- Mantle price rose 6% to above $1.04, with gains coming as Bitcoin (BTC) retested the $71k level.
- MNT price had struggled to break out of a tight range.
- Network developments and the overall crypto market outlook could help MNT price higher.
Mantle (MNT) price currently changes hands around $1.04 after jumping more than 6% in the past 24 hours alongside Bitcoin’s spike to above $71,000.
The cryptocurrency’s daily trading volume is up 110% to over $13o million in this period as Mantle trends among the best performers in the top 100 coins by market cap.
MNT price surges amid crypto bounce
Today’s gains for MNT price came as Bitcoin price surge to above $71k, with bulls taking advantage as spot BTC ETFs recorded an 11th consecutive trading day of net inflows.
Analysts are bullish on BTC, and projections for ETH amid spot Ethereum ETF approval could also contribute to MNT price going up.
Notably, MNT surged more than 40% in March, breaking above $1 as bullish momentum eventually pushed the token’s value to an all-time high above $1.50 in April.
While MNT benefitted from listing on South Korea’s largest crypto exchange Upbit, the parabolic rise that catapulted BTC to its ATH may also have fueled the upswing. The project’s introduction of the Mantle Rewards Station also added to the positive sentiment.
Mantle price – are bulls ready to run?
While MNT price has struggled since dipping below $1.40 in mid-April, it’s likely a new push in the SocialFi and gaming dApps space has Mantle poised for a fresh rally.
Mantle recently revealed it had deployed a $5 million ecosystem fund to support projects such as MetaCene, Blade Games, Co-Museum and Fingerlabs. The initiative has boosted the network’s protocols across lending, liquid staking, DEX, yield and RWA.
Data from DeFiLlama indicates the Total Value Locked (TVL) across these projects has nearly doubled in the past month. Per the details, Mantle TVL currently stands at around $463 million, up from approximately $252 million in early May.
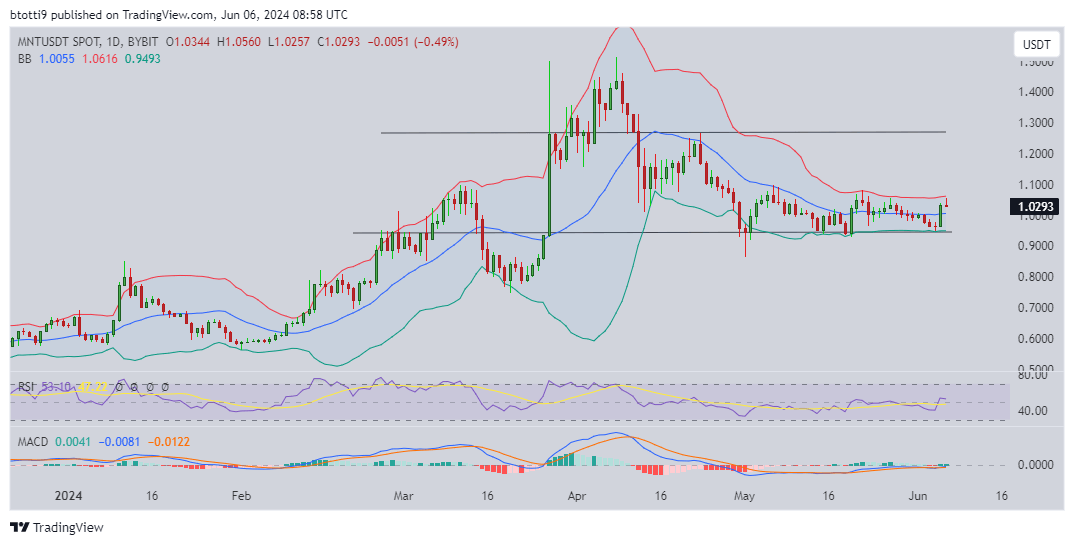
MNT price on the daily chart is within a key range marked by the Bollinger bands. If bulls break higher, a decisive move above $1.10 may allow for a retest of the resistance line at $1.26.
The RSI and MACD indicators, however, suggest bears are not completely out of the picture. Primary support levels in case of a downward flip would include $0.94 and $0.78.


