


Bitcoin’s latest pullback has not persuaded Blackbay Capital president Todd Butterfield to re-enter the market. In a fresh BTC/USD daily chart on Bitfinex, shared on X, the Wyckoff specialist reiterates: “Yes, I am still on the sidelines with#BTC. Our Wyckoff indicators are still not flashing BUY. We are new below the .382 retracement as well…”.
Wyckoff Analysis Predicts Deeper Bitcoin Price Correction
The chart covers May to 17 November 2025 and shows Bitcoin trading at $92,838. Across this period Butterfield maps a textbook Wyckoff distribution. The advance into early summer culminates in a Buying Climax (BC) just above $123,000, followed by an Automatic Reaction (AR) that establishes support slightly above $112,000. A Secondary Test (ST) revisits the BC area, confirming the white horizontal resistance band drawn around the $123,000 region.

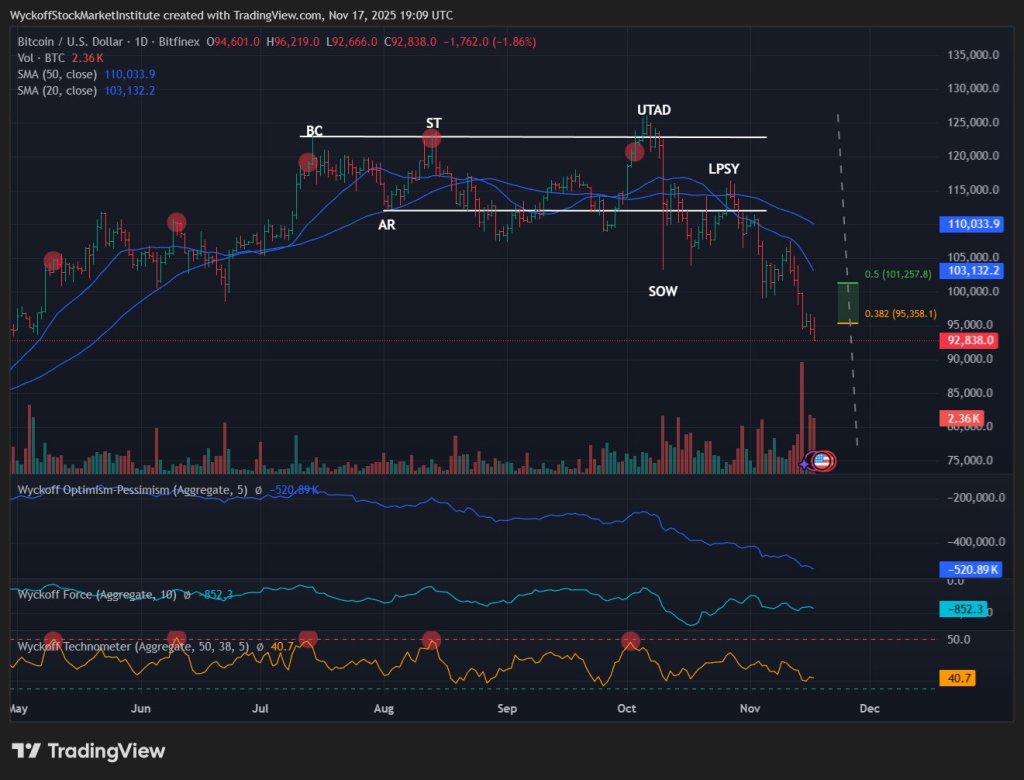
Later, price marginally exceeds that ceiling in an Upthrust After Distribution (UTAD), before failing back into the range. Under Wyckoff logic this marks the terminal trap for late buyers and confirms that large players are distributing. Once the UTAD fades, Bitcoin breaks below the AR line in a Sign of Weakness (SOW), then produces a lower high labelled Last Point of Supply (LPSY), where a rally stalls beneath former support.
Trend metrics back the bearish structure. The 20-day simple moving average sits at $103,132.2 and the 50-day SMA at $110,033.9, both sloping downward. With spot at $92,838, BTC is decisively below both moving averages, consistent with Wyckoff’s markdown phase rather than the start of a new accumulation.
Butterfield also overlays Fibonacci retracements of the preceding uptrend. Two levels are explicitly marked: the 0.382 retracement at $95,358.1 and the 0.5 retracement at $101,257.8. Bitcoin is currently below the 0.382 line, the condition he highlights in his post as reinforcing a non-bullish stance. A small vertical bracket between current price and the 50% level visually underscores how far BTC would need to rebound to test a deeper retracement.
Below price, three proprietary Wyckoff indicators drive his decision to stay sidelined. The Wyckoff Optimism–Pessimism (Aggregate, 5) line trends steadily lower and now sits near –520.89K, signalling persistent net selling throughout the distribution. The Wyckoff Force (Aggregate, 10) indicator has rolled into negative territory at around –852.3, reflecting downside progress backed by meaningful volume, particularly on the SOW and follow-through selling.
The Wyckoff Technometer (Aggregate, 50, 38, 5), plotted as an orange oscillator, has repeatedly flagged overbought conditions above the 50 line near earlier peaks in June, July, August and October. Today it reads 40.7—below overbought yet still above the oversold band around 38. In Butterfield’s framework, that mid-range reading does not qualify as a low-risk buy zone.
At press time, BTC traded at $91,570.
Featured image created with DALL.E, chart from TradingView.com
Editorial Process for is centered on delivering thoroughly researched, accurate, and unbiased content. We uphold strict sourcing standards, and each page undergoes diligent review by our team of top technology experts and seasoned editors. This process ensures the integrity, relevance, and value of our content for our readers.


