


In the world of IoT, we often find ourselves searching for efficient ways to get data from sensors to a place where it can be stored and visualized. IoT devices generate massive amounts of telemetry data, but managing this data effectively is often more complex than it seems.
Typically, setting up an infrastructure involves multiple components: an MQTT broker for data ingestion, a service like Node-RED to process and save the data, a database such as InfluxDB for storage, and a visualization tool like Grafana. Many IoT enthusiasts and professionals end up self-hosting these components on a server or in a homelab. However, this approach frequently leads to spending more time configuring and maintaining the setup rather than building devices, expanding sensor networks, or analyzing data to take action.
This guide focuses on an efficient way to tackle these challenges using Telemetry Harbor. By the end, you’ll understand how to push your IoT data to the cloud and visualize it effortlessly—without the need to self-host or configure complex infrastructures.
The Problem
IoT enthusiasts often struggle with the complexity of setting up systems to collect, store, and visualize telemetry data. The process typically involves configuring tools like MQTT brokers, databases, and visualization platforms, which requires technical expertise and significant time investment. Setting up data ingestion servers, whether using MQTT or HTTP, can be a complicated and time-consuming task. After that, choosing the right database—such as a time-series database like InfluxDB or TimescaleDB or a general-purpose solution like PostgreSQL—adds another layer of complexity. Once the database is set up, creating dashboards with tools like Grafana involves connecting the database, designing visualizations, and managing user access. But the challenges don’t end there.

Maintaining a self-hosted system comes with ongoing responsibilities such as updates, backups, and scaling, which only become more demanding as data volumes increase. This leads to high operational costs for hosting and infrastructure, which can grow quickly as projects scale. Enthusiasts often find themselves spending more time on managing the infrastructure than on innovating or deploying devices, which can be frustrating and divert attention away from the core goals of IoT development.
Simplify Everything with Telemetry Harbor
Telemetry Harbor is a platform that provides a complete full-stack solution as a service. From ingesting data through an easy-to-use HTTP endpoint (with more protocols coming soon) to storing it in a well-optimized, managed database, and offering pre-configured Grafana templates for visualization, Telemetry Harbor streamlines the entire process. In just a few minutes, you can go from creating an account to visualizing your first data point—no complex setup or infrastructure management required.
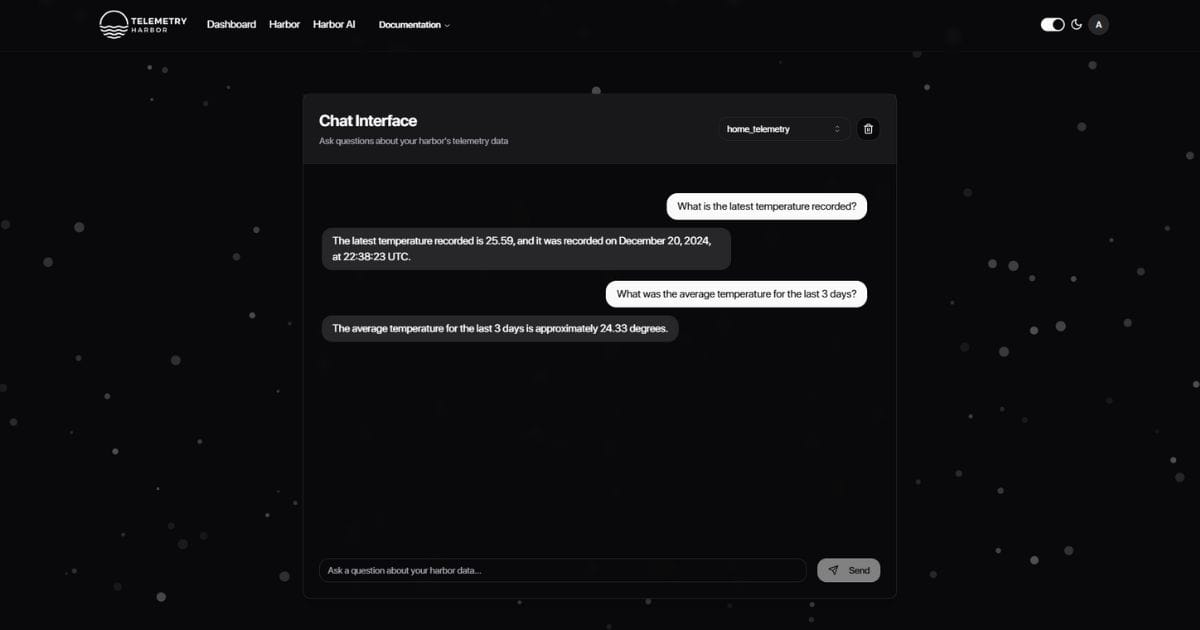
Not sold yet? Telemetry Harbor has rolled out the beta of Harbor AI, where you can interact with your data using a large language model—essentially, you can talk to your data in your natural language. No need to create complex Grafana dashboards for a simple value; just ask your Harbor. While this feature is still in beta, every user has a maximum of 10 questions per day.
They offers a generous free tier that makes it easy to get started without any upfront costs. With the free plan, you’ll get 10 requests per second, 1 batch request per second, and up to 10 data points per batch. Your data is retained for 30 days, and you’ll have unlimited storage and shared access to Grafana. While the free tier includes basic backup and support, it’s a great way to explore the platform’s capabilities. As your needs grow, you can easily scale up. For more details on the free plan and other pricing options, check out our pricing page.
Getting Started with Telemetry Harbor
Let’s walk through how to get started and push your first data point to Telemetry Harbor. We’ll follow the official documentation, and you can always check the latest guide here: Getting Started Guide.
Step 1: Create Your Account
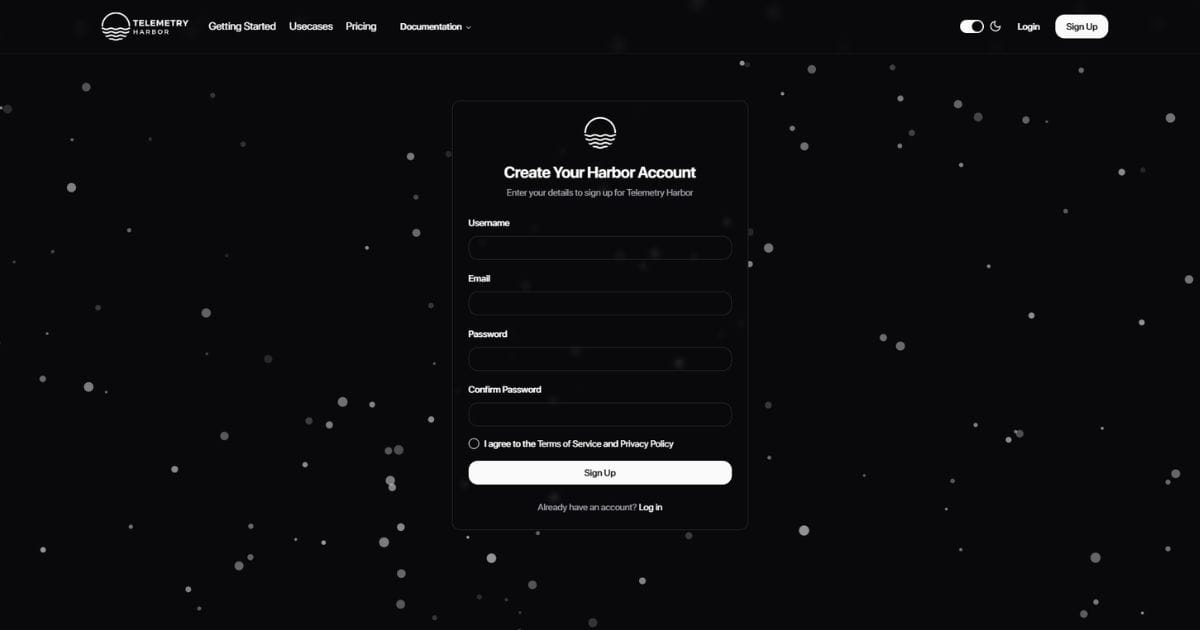
- Go to the Sign Up page.
- Fill in your details and create your account.
- Check your inbox for a verification email.
- Click the verification link to activate your account.
- After activation, log in to your account.
- Now, head to the Harbor Page.
Step 2: Set Up Your Harbor
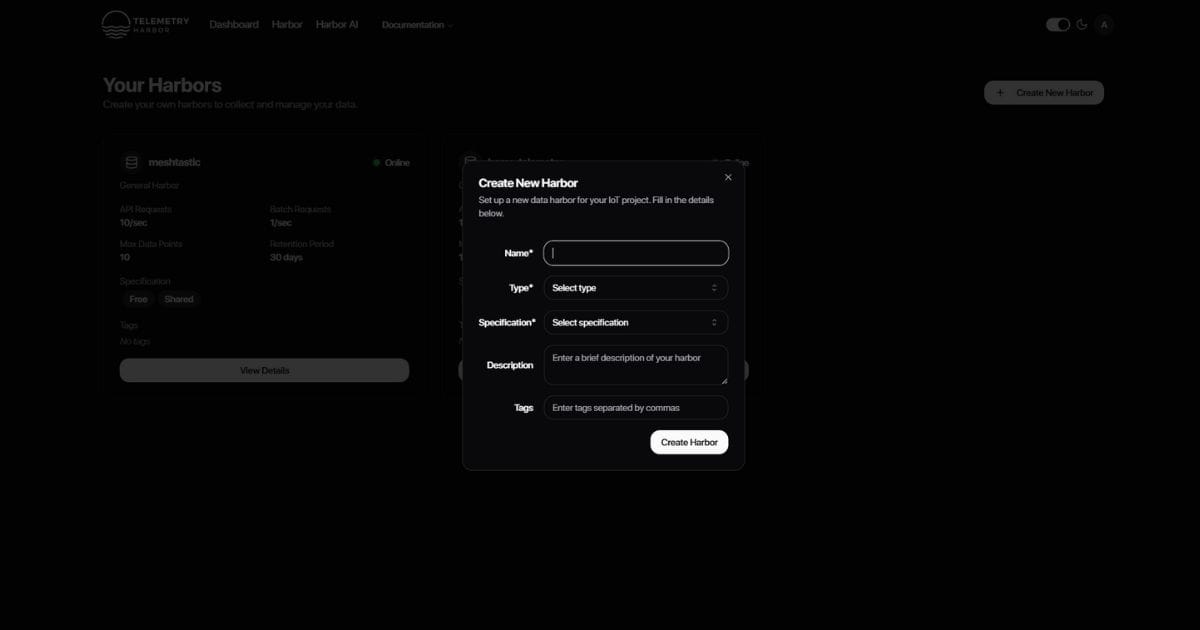
- In the top right corner, click on Create Harbor.
- Give your harbor a name.
- Choose the harbor type. For now, select the general type (custom types like GPS or temperature data will be added soon).
- Choose your Harbor Specifications. If you want to use the free tier, select Free.
- Click Create Harbor to finish setting up your harbor.
- After creating your harbor, the harbor list will update, and you’ll see your new harbor listed.
- Click View Details to access essential information like the API Endpoint, API Batch Endpoint, API Key, Grafana Endpoint, Grafana Username, and Grafana Password.
Step 3: Get Your API Key and Endpoint
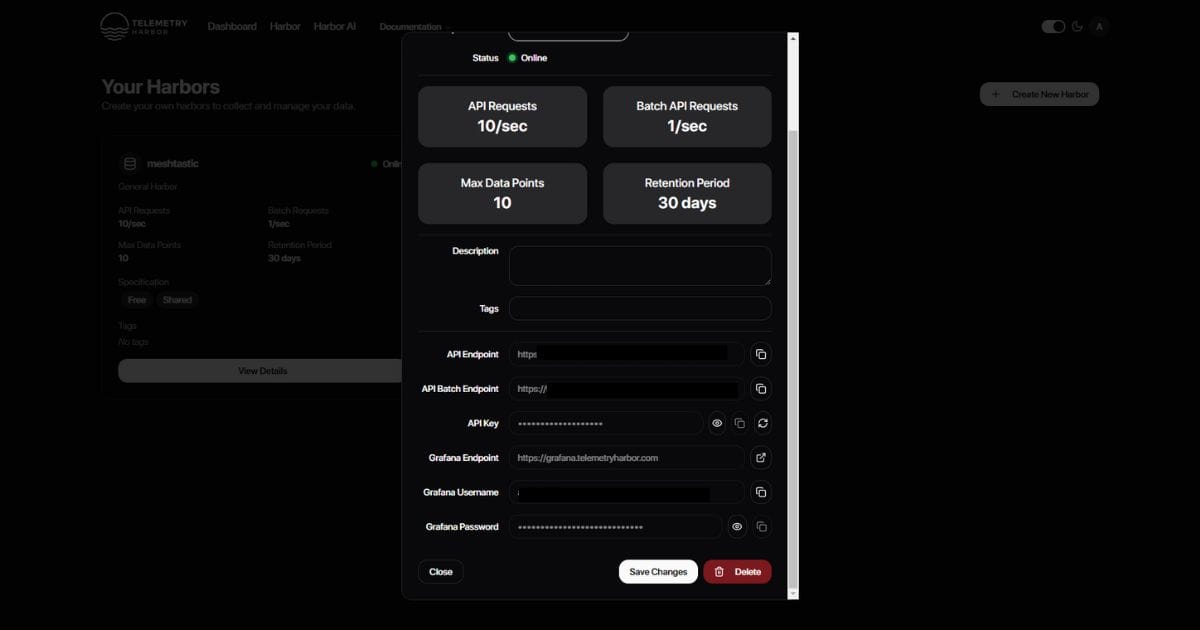
- Find the API Endpoint (make sure to use the standard endpoint, not the batch one, since we’re sending just one data point).
- Copy the API Key and API Endpoint. Keep these handy for the next step.
Step 4: Push Your First Data Point
To send your first data point, you’ll need to make a POST request to the API endpoint.
- Include the header:
X-API-Key: your_api_key_here. - Structure the POST body like this:
{
  "time": "2024-11-18T19:24:00.948Z",
  "ship_id": "string",
  "cargo_id": "string",
  "value": 0
}
You can use curl or any programming language/tool that can send POST requests. Here’s an example using curl:
curl -X POST https://telemetryharbor.com/api/v1/ingest/ingest/harbor_id
-H "X-API-Key: your_api_key"
-H "Content-Type: application/json"
-d '{
    "time": "2024-11-18T19:44:16.160Z",
    "ship_id": "string",
    "cargo_id": "string",
    "value": 0
}'
If everything goes smoothly, you should get a code 200 response, confirming that your data has been received.
Step 5: View Your Data
- Go back to the Harbor Details page.
- Copy the Grafana Password and open the Grafana Endpoint.
- Log in using your Grafana Username (this will be the same as your Telemetry Harbor email) and the Grafana Password.
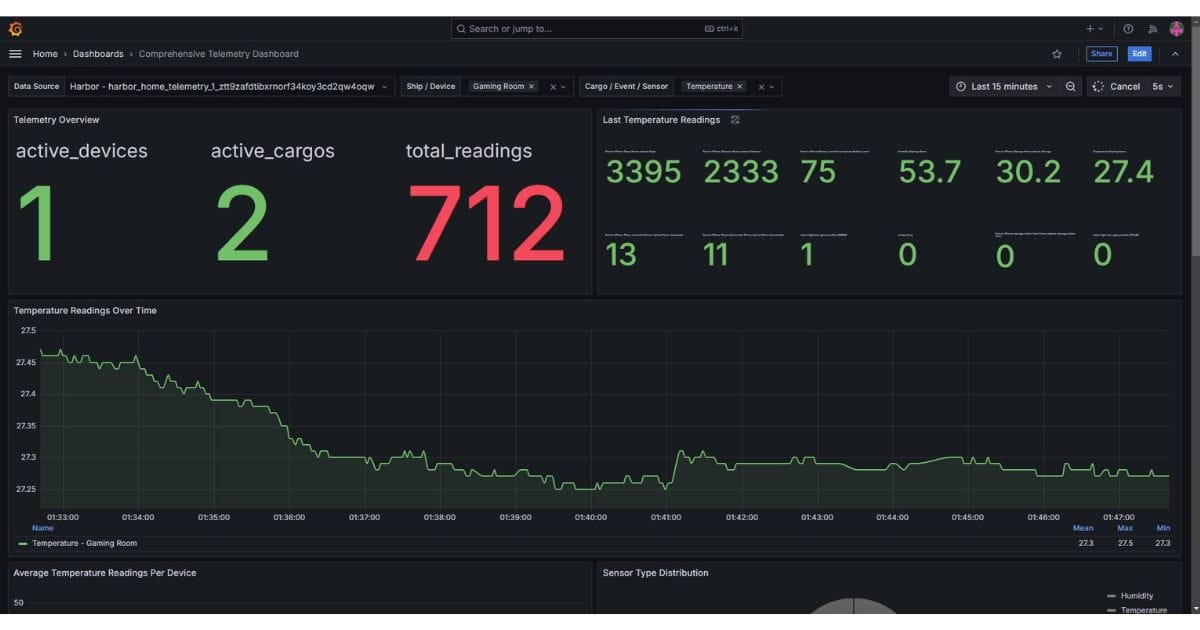
- Once logged in, go to Dashboards and select the Comprehensive Telemetry Dashboard (this is the demo dashboard provided by Telemetry Harbor).
- Inside the dashboard:
- Choose your data source (which will be your harbor).
- Use the filters to view data based on
ship_idandcargo_id.
From there, you’ll find several panels in the dashboard, and you’re free to customize them or even create entirely new ones to suit your needs. If you scroll down, you’ll also see a map. This is because, even with the general harbor type, you can push GPS coordinates to visualize location data. While the process for doing this is a bit unconventional, the documentation provides clear and detailed instructions on how to handle it effectively. For more information, check out the official guide on working with GPS data at Telemetry Harbor GPS Data API Documentation.
Key Concepts
- Harbors: These are logical containers that organize your data into manageable groups, making it easier to analyze.
- Ships: These represent individual devices or data sources that send data to your harbors.
- Cargo: The sensors or devices on your ships that capture and send the data.
ship_idandcargo_id: These values can be any string. It’s important to stick to a consistent naming scheme to ensure proper grouping and filtering when analyzing data in your dashboards.
In conclusion, Telemetry Harbor takes the complexity out of managing IoT data by providing a seamless, cloud-based solution for data collection, storage, and visualization. This enables you to focus on what truly matters—your devices and the insights they generate—rather than dealing with the technicalities of infrastructure setup. With just a few simple steps, you can start pushing data to the cloud and viewing it in a pre-configured Grafana dashboard, eliminating the need for extensive configuration or maintenance. The free tier offers an accessible way to get started. This approach allows you to spend more time innovating with your devices and less time managing the systems that support them.


